 Flippd Help
How do I see which categories and platforms are most profitable?
Open the Reports tab and scroll to the Category Performance, Platform Performance, and Source Performance sections to see which types of items, selling platforms, and sourcing spots make you the most money.
Category Performance
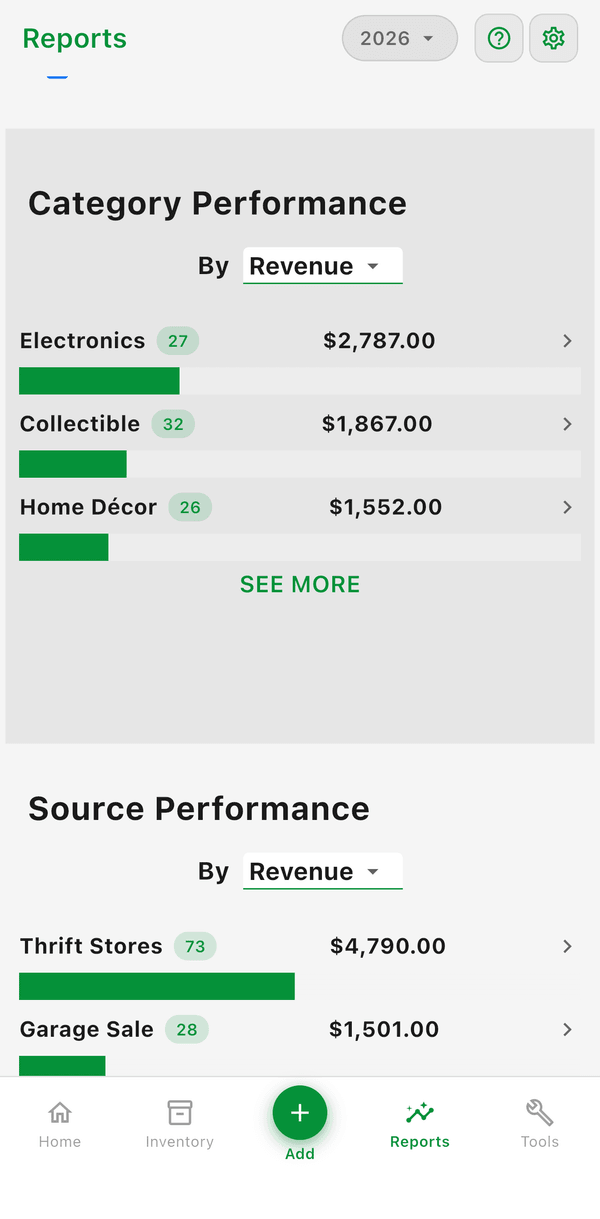
See how each item category (Clothing, Electronics, Collectibles, etc.) performs as a bar list. Use the By picker to rank categories by:
- Revenue
- Profit
- ROI
- Count (number of sales)
Tap SEE MORE to expand the full list. Use this to focus your sourcing on the most profitable item types.
Platform Performance
Compare your selling platforms in a pie chart. Use the By picker to slice it by:
- Revenue
- Profit
- Count (number of sales)
Use this to decide where to focus your listings for maximum profit.
Source Performance
See where your best inventory came from (thrift stores, estate sales, garage sales, and so on). It works the same way as Category Performance: rank by Revenue, Profit, ROI, or Count, and tap SEE MORE for the full list.
Drill Down into Inventory
Tap a platform slice, a category bar, or a source bar to jump directly to your Inventory screen, filtered to show only items matching that selection. This lets you:
- See exactly which items sold on a specific platform
- Browse all items in a category to spot patterns
- Take action on items that match the filter (relist, reprice, etc.)
Good to Know
- These breakdowns cover the year selected at the top of the Reports screen
- A category with high profit but low volume might be worth pursuing
- A platform with lower fees might be more profitable even if it has fewer sales
- Tapping a breakdown takes you directly to the filtered inventory view for quick action