 Flippd Help
How do I view my daily and monthly sales reports?
To view your reports, tap the Reports tab in the bottom navigation. The Reports screen has five tabs: Daily, Weekly, Monthly, YTD (Year-to-Date), and Compare.
Report Tabs
Daily Tab
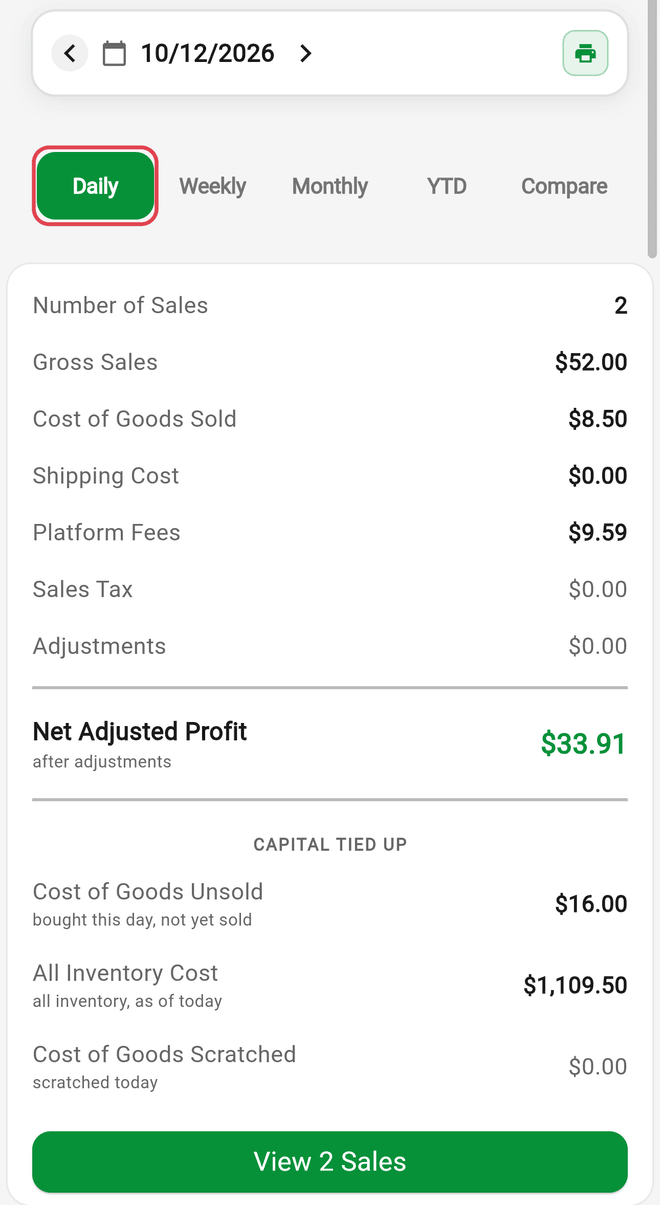
See what happened on a specific day. The Daily tab shows the same rows as the Monthly tab (sales, expenses, and mileage) for that one day, including:
- Number of Sales
- Gross Sales
- Net Profit
Use the arrows (or tap the date) to move between days.
Weekly Tab
The same rows for a full week. Use the arrows to move between weeks.
Monthly Tab
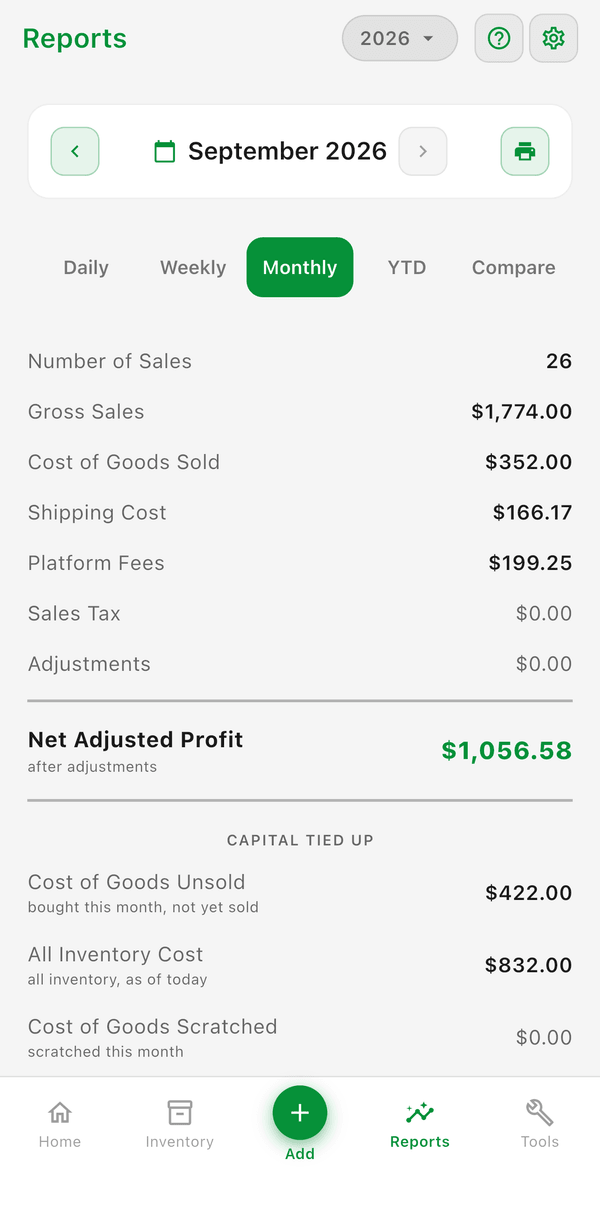
Get a comprehensive view of your monthly performance:
| Metric | What It Shows |
|---|---|
| Number of Sales | Number of items sold |
| Gross Sales | Total amount before expenses |
| Cost of Goods Sold | What you paid for sold items |
| Shipping Cost | Total shipping expenses |
| Platform Fees | Total fees paid to platforms |
| Sales Tax | Sales tax you remitted |
| Adjustments | Refunds, returns, and other deductions |
| Net Profit | Your actual earnings |
| Net Adjusted Profit | Net profit after expenses and adjustments |
| Cost of Goods Unsold (Capital Tied Up) | What you've spent on items that haven't sold yet |
| Cost of Goods Scratched | Cost of items you wrote off |
Tap View N Sales to see every sale behind the numbers in a Sales Details sheet.
YTD Tab
Track your annual progress with running totals for the current year across all key metrics. See how your business is performing against the full year.
Compare Tab
Compare the selected year against the previous year side-by-side. Useful for tracking growth, identifying seasonal patterns, and setting realistic goals for the next year.
Expenses, Mileage, and Status Breakdown
Every tab also includes an Expenses and Mileage section (Number of Expenses, Total Expenses, Miles Driven, Mileage Deduction) so your report reflects your full costs.
The Status Breakdown section shows Sold Items, Listed Items, Unlisted Items, Death Pile, and Write-offs with the cost Invested in each, an At Risk percentage, and your ROI and Avg Profit Margin on sold items.
Tax Reports and All Time
Further down the Reports screen, the Tax Reports section links to your P&L Statement, Schedule C Summary, and Mileage Log export.
Choosing All in the year picker at the top switches to an All Time report with per-year totals and a Year over Year chart. The tabbed views need a specific year, so you'll see "To view report, select a year at the top of the screen instead of All" until you pick one.
Print or Save a Report as a PDF
You can turn any report into a printable PDF directly from the Reports screen. The print feature defaults to PDF, so there's no separate "export to PDF" option in Settings -- printing happens right from Reports.
- Open the Reports tab and select the tab you want -- Daily, Weekly, Monthly, YTD, or Compare (printing is available on all five)
- Tap the print icon in the date navigation bar at the top of the screen
- Use the date arrows to choose the day, week, month, or year you want before printing
- Flippd builds a PDF and opens your device's print/share dialog, where you can print it or save/share it as a PDF
This is different from Tools > Import/Export, which exports your raw data as an Excel or CSV file by year (or all data) -- it does not produce a PDF and does not support custom month or week ranges. Use Import/Export when you need a spreadsheet of your inventory, sales, or expenses; use the Reports print icon when you want a formatted PDF summary.
Pull to Refresh
Pull down on any report tab to refresh the data. This forces Flippd to recalculate all metrics from your latest sales, expenses, and inventory data. Use this if numbers seem stale or after making changes.
Good to Know
- Report data is cached for a few minutes -- the screen shows "Last updated (pull screen down to refresh)", so pull down after recording sales
- Tap View N Sales to see every sale behind the numbers
- Tap a platform slice or category bar in the charts to drill down into the filtered inventory view
- Use monthly reports to spot trends and plan your sourcing strategy