 Flippd Help
How do I track my annual progress and compare years?
To track your annual progress, open the Reports tab and choose the YTD tab. Use the Compare tab to see the selected year against the previous year, or choose All in the year picker for an All Time view.
Year-to-Date (YTD) Reports
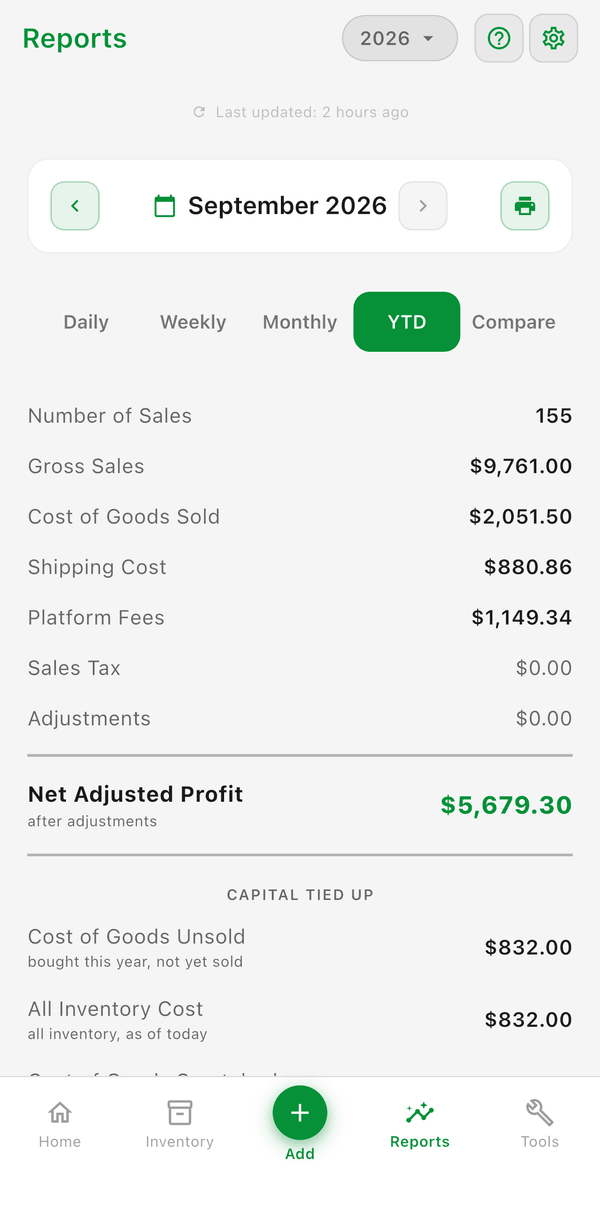
The YTD tab shows running totals for the selected year, using the same rows as the Monthly tab:
- Number of Sales, Gross Sales, Cost of Goods Sold, Shipping Cost, Platform Fees, Sales Tax, Adjustments, Net Profit, and Net Adjusted Profit
- Expenses and Mileage -- Number of Expenses, Total Expenses, Miles Driven, Mileage Deduction
- Status Breakdown -- where your ROI and Avg Profit Margin on sold items appear
Year Comparison
The Compare tab shows the selected year against the year before it (for example, 2025 vs 2026). Change the year in the picker at the top to compare a different pair. Each row has a Change column:
- Number of Sales, Gross Sales, Cost of Goods Sold, Shipping Cost, Platform Fees, Adjustments
- Net Profit, Net Adjusted Profit
- Cost of Goods Unsold, Cost of Goods Scratched
- Expenses, Miles Driven, Miles Deducted
Tap the print icon to save it as a Flippd Year Comparison Report PDF. Use it to track growth and identify seasonal patterns across years.
All Time and Year-End Summaries
- Choose All in the year picker to open the All Time report, which lists totals for every year and shows a Year over Year chart once you have at least two years of data
- For a complete annual breakdown, open Reports > Tax Reports > P&L Statement, which covers one year at a time and exports to PDF or CSV
Good to Know
- YTD numbers reflect the sales and expenses you've recorded -- pull down on the Reports screen to refresh after adding new ones
- Use year comparisons to set realistic goals for the upcoming year